
With custom dashboards being released late last year for Account Reconciliations, customers have had a lot of time to digest what is needed for period end reporting versus period end statistical data evaluations.
Prior to custom dashboards being released, there were two main ways to report off your data:
- Custom BI Reports
- Custom Views in Reconciliations
The custom report route allows customers to create their own downloadable report (via excel, PDF, or HTML) by writing the SQL from scratch or by using the query generator.
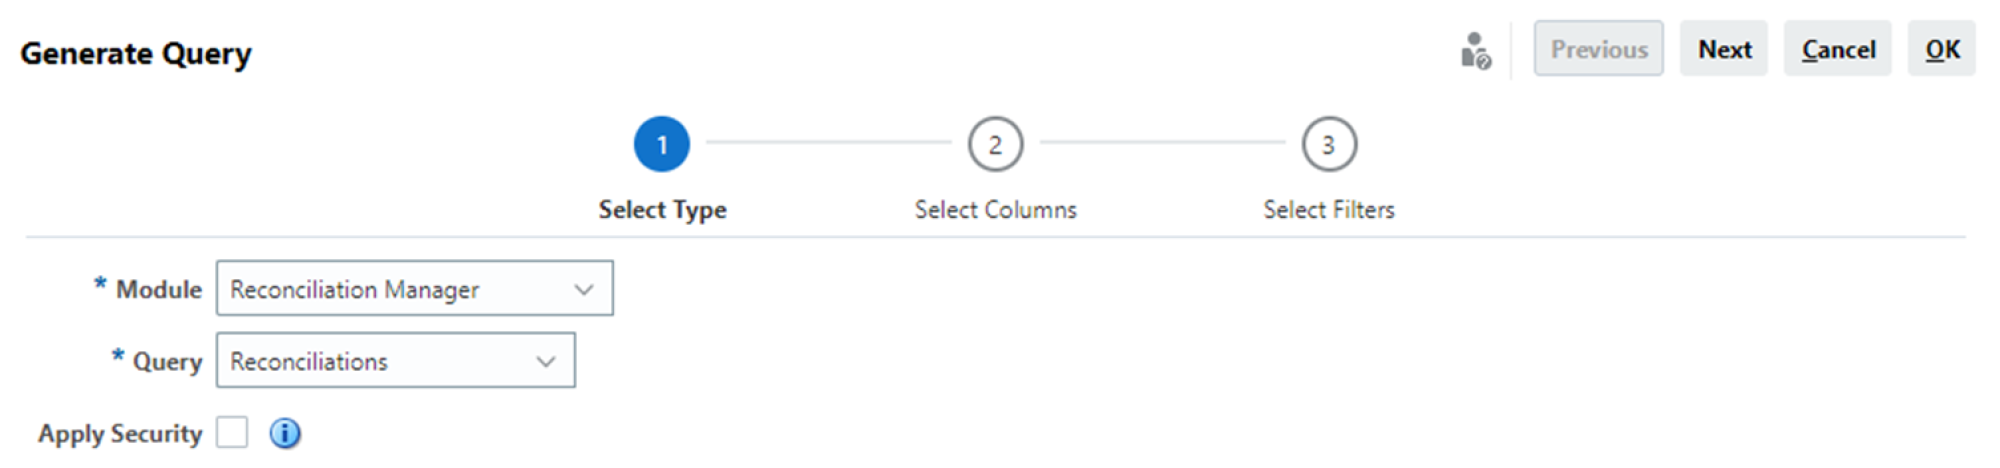
From within the Query Generator, users can select the module (Reconciliation Compliance or Transaction Matching) and the query (Reconciliations, Profiles, Transactions) from which the data is coming. The appropriate columns and filters can then be selected. Once the query is generated, there are a few more steps to finalize your report like creating the report template and RTF (but that’s a story for another time).
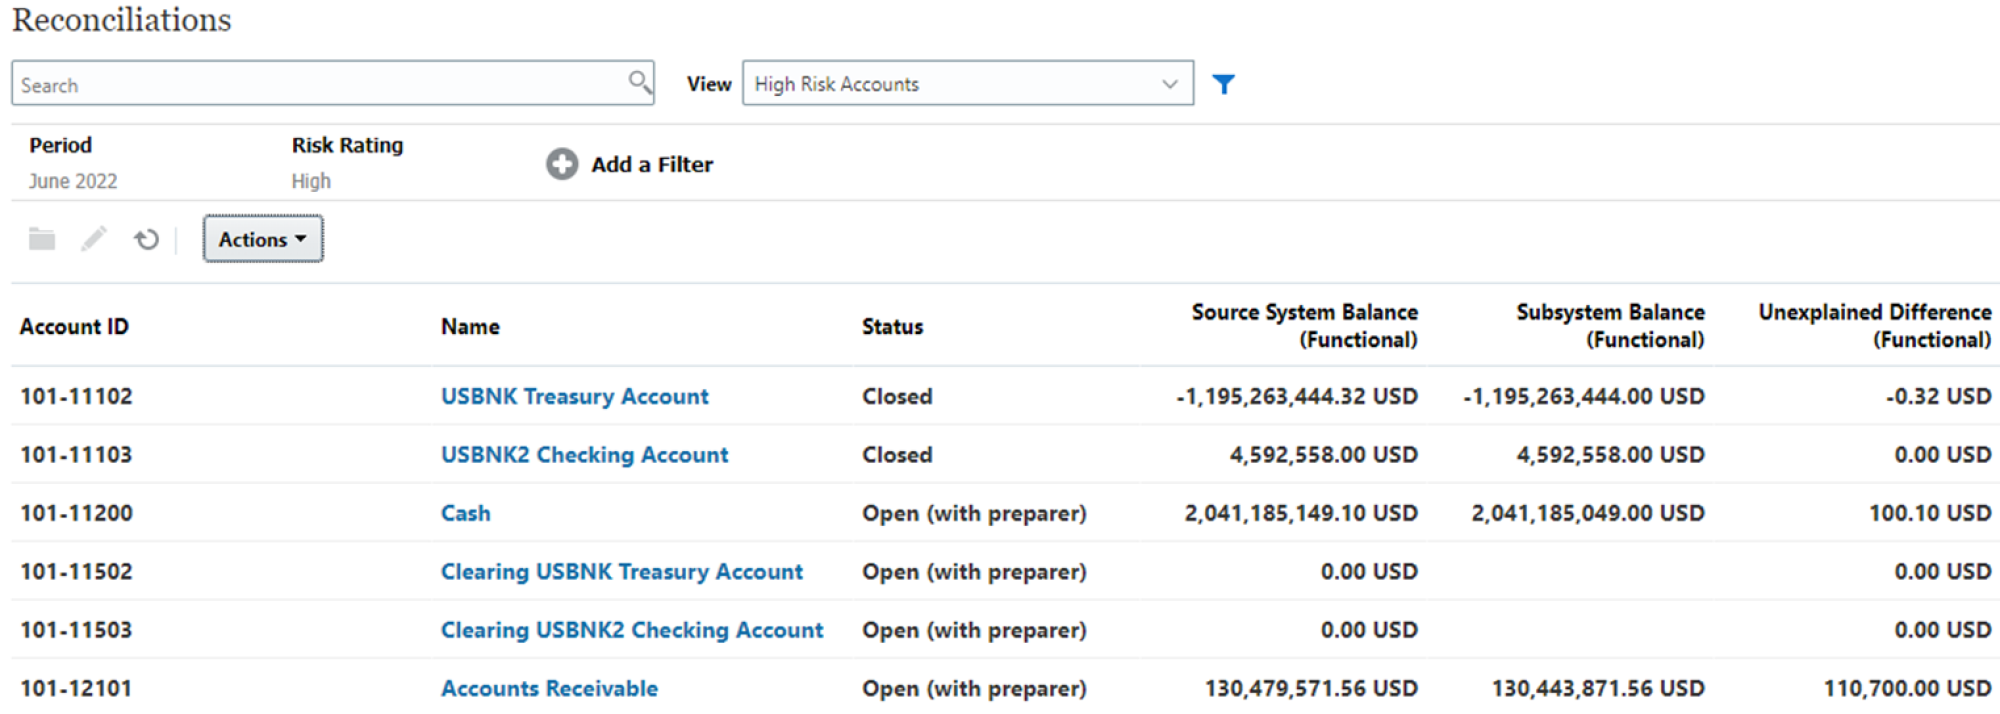
The custom view in the Reconciliations card is the most popular way to gather and report on information. While individual users can create their own views and reuse them each period, management can also have views created for them and Excel extracts can be run manually. Filters and columns of data can include everything from current workflow status, source system balance, unexplained difference, account type, late status, etc. There are thousands of different combinations that can be created to get a list of the information you want to report on. The information updates instantly each time you refresh the page or select a different view.
Oracle Account Reconciliation custom dashboards
Oracle Account Reconciliation offers pre-built dashboards for a general overview, but the real power comes from custom dashboards. These dashboards allow you to design what information you see and how you see it. With customizable charts, lists, and pivots, you can gain deep insights into your reconciliation process. You can track completion rates by various factors, analyze trends over time, and identify areas needing attention. This level of detail empowers you to improve efficiency and ensure timely, accurate reconciliations.
This next section will discuss three popular dashboards that assist in identifying reconciliation burn downs, late reconciliation users and counts, and a pivot table for unmatched or supported transactions.
Reconciliation burn down trend
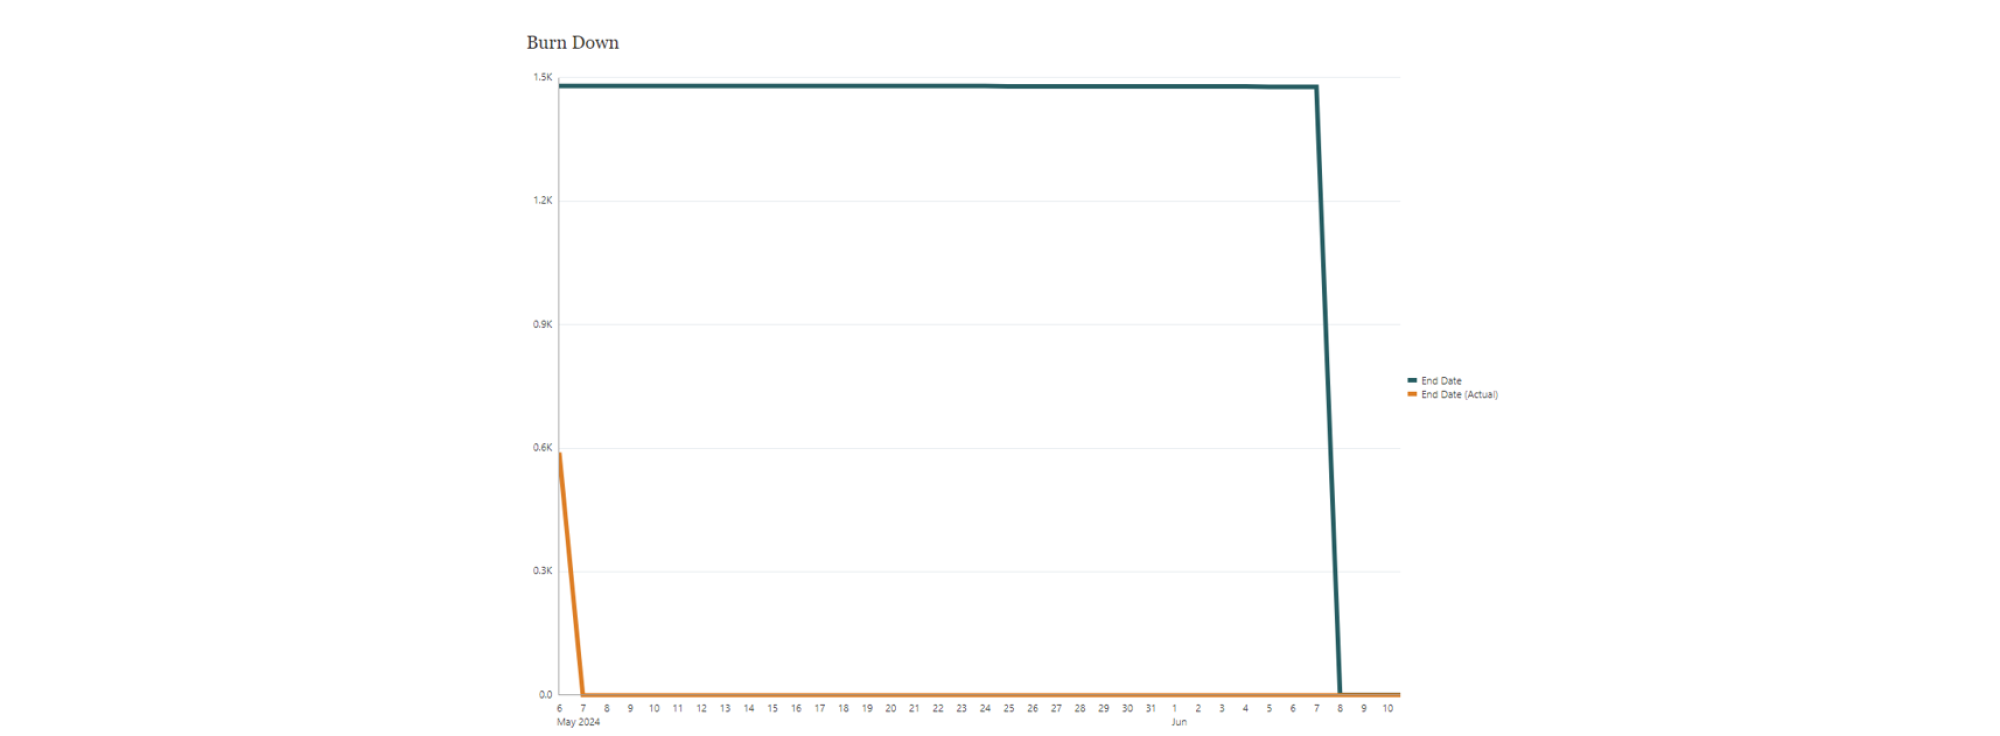
The reconciliation burn down trend tracks the amount of work/reconciliations remaining in a period. In a perfect scenario, the trend line would slope steadily downwards, signifying work is getting completed and the remaining workload is decreasing. This is a great visualization to help predict if the reconciliations will be finished on time.
In the example below, you can see that June 8th is the due date for the period end reconciliations, but they were all finished by May 7th. This view allows management to see that users were given ample time to complete the recons and they can think about shortening their close by a few weeks.
Four-quadrant dashboard
This visualization would track the number of outstanding reconciliations assigned to each user/team. By including a list view alongside the chart, you can see details for each overdue reconciliation, including the assigned user and the specific account or process causing the delay. This allows you to quickly identify bottlenecks and assign resources where needed, ensuring timely completion of the reconciliation process.
Each quadrant can be individually configured to pull from different areas of Account Reconciliation.

Pivot table examples: unmatched or supported transaction and rejected reconciliations
Pivot tables offer several benefits for analyzing reconciliation data:
- Uncover hidden insights: Pivot tables allow you to swap rows and columns, giving you different perspectives on your data. This flexibility can reveal trends or patterns you might otherwise miss. For example, you could pivot a table of reconciliations by user and account dimension, to identify which users are consistently struggling with specific accounts.
- Simplify complex data: Reconciliations often involve multiple data points. Pivot tables can aggregate this information, making it easier to understand. This can give you a quick snapshot of overall trends.
- Dynamic analysis: Pivot tables are dynamic, meaning you can change the view of your data on the fly. You can add or remove filters and sort data by different criteria. This makes it easy to explore your data from different angles and gain a comprehensive understanding of your reconciliations.
In the examples below, we’ll take a tour of two pivot tables: one for unmatched or supported transactions in Transaction Matching and the other showing the number of period end reconciliations that were rejected with their associated accounts.
The example below shows how a pivot table can be created to view data quickly in a match type. In this example, I want to see how many transactions remain unmatched, what the tender type is, and what the value of that tender type is. By selecting the “tender type” of the transaction for an attribute which is my first column, I can then select the values I want to see next to them. In this case, I selected Trans Amount and Transaction Count. This allows me to quickly and efficiently see the status of my unmatched items for all or specific data sources in my Match Type.

This last example shows how easy it is to view which recons were rejected in a period, who the preparer or preparing team was, and what the account was. This is a helpful view if you want to identify which accounts are constantly rejected, thus causing a bottleneck in your close. All that needs to be done is to select the Account and Preparer as your attributes and then the Rejections (Count) as your value. This pivot table will even let you drill into the rejected reconciliation if you click on the number of rejections!

By leveraging Oracle Account Reconciliation Custom Dashboards, you can transform reconciliations from a chore into a strategic process. Gain deeper insights, identify bottlenecks, and ensure timely and accurate reconciliations. Take control and optimize your reconciliation process today!
About Oracle Account Reconciliation
Oracle Account Reconciliation is fully integrated with Oracle Cloud EPM for a complete, end-to-end financial close process. Oracle account reconciliation cloud service can help you close faster by automating account reconciliations and transaction matching, improving the efficiency and accuracy of your financial statements while addressing security and risk.